Generative Model Performance Metrics
Introduction
There are a multitude of indexes that contain valuable information on how the model is performing. This guide will go over the two groups of metrics, Layar API metrics and VLLM metrics.
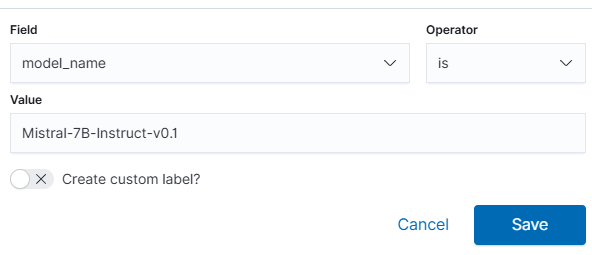
Filtering by Model Name
In version 1.10 of Layar, multiple models can be serviced on a single instance. In order to look at the performance of the a specific model, you can use the model_namefield to filter for a specific model.
Layar API Metrics
When a request is sent to the generate endpoint. Multiple metrics are output in the logs that can be used to determine the performance of the endpoint. Each metric has the following sub-values:
- Current - The amount of time in seconds a specific request metric took to complete.
- Min - Minimum amount of time in seconds the request metric took to complete.
- Max - Maximum amount of time in seconds the request metric took to complete.
- Mean - Mean amount of time in seconds the request metric took to complete.
index_and_retrieve
The time it takes for the generate workflow to retrieve desired documents from the vector store.
hybrid_query_search
The time it takes for the generate workflow to perform both keyword search and vector search on the documents being prompted against.
check_indexed_documents
The time it takes for the generate workflow to find embedded documents being prompted against.
injest_and_index_documents
The time it takes for the generate workflow to embed documents, if the document is not already embedded.
create_prompt
The time it takes for the generate workflow to prepare the prompt for the model.
process_input_data
The time it takes for the generate workflow to preprocess vector data for the model.
process_raw_response
The time it takes for the generate workflow to process the response returned by the model.
ttft (time to first token)
The time it takes for the first token to come back when streaming is enabled.
overall
The time it takes for the generate workflow to complete.
VLLM Dashboard
Certara Generative AI makes use of VLLM to service your model of choice. The dashboard allows you to view metrics that come directly from VLLM.
Accessing the Metrics
The VLLM metrics are accessed by doing the following:
- Login to OpenSearch Dashboard.
- Click the hamburger icon in the top left.
- Click "Dashboard" in the left panel.
- Click "Add" in the top right.
- Choose "KV Cache Percentages" , "Requests being processed" and "Throughput Numbers".
- Click the X in the top right.
- Save the dashboard that now contains the VLLM metrics.
After following the above steps you will have the following dashboard.
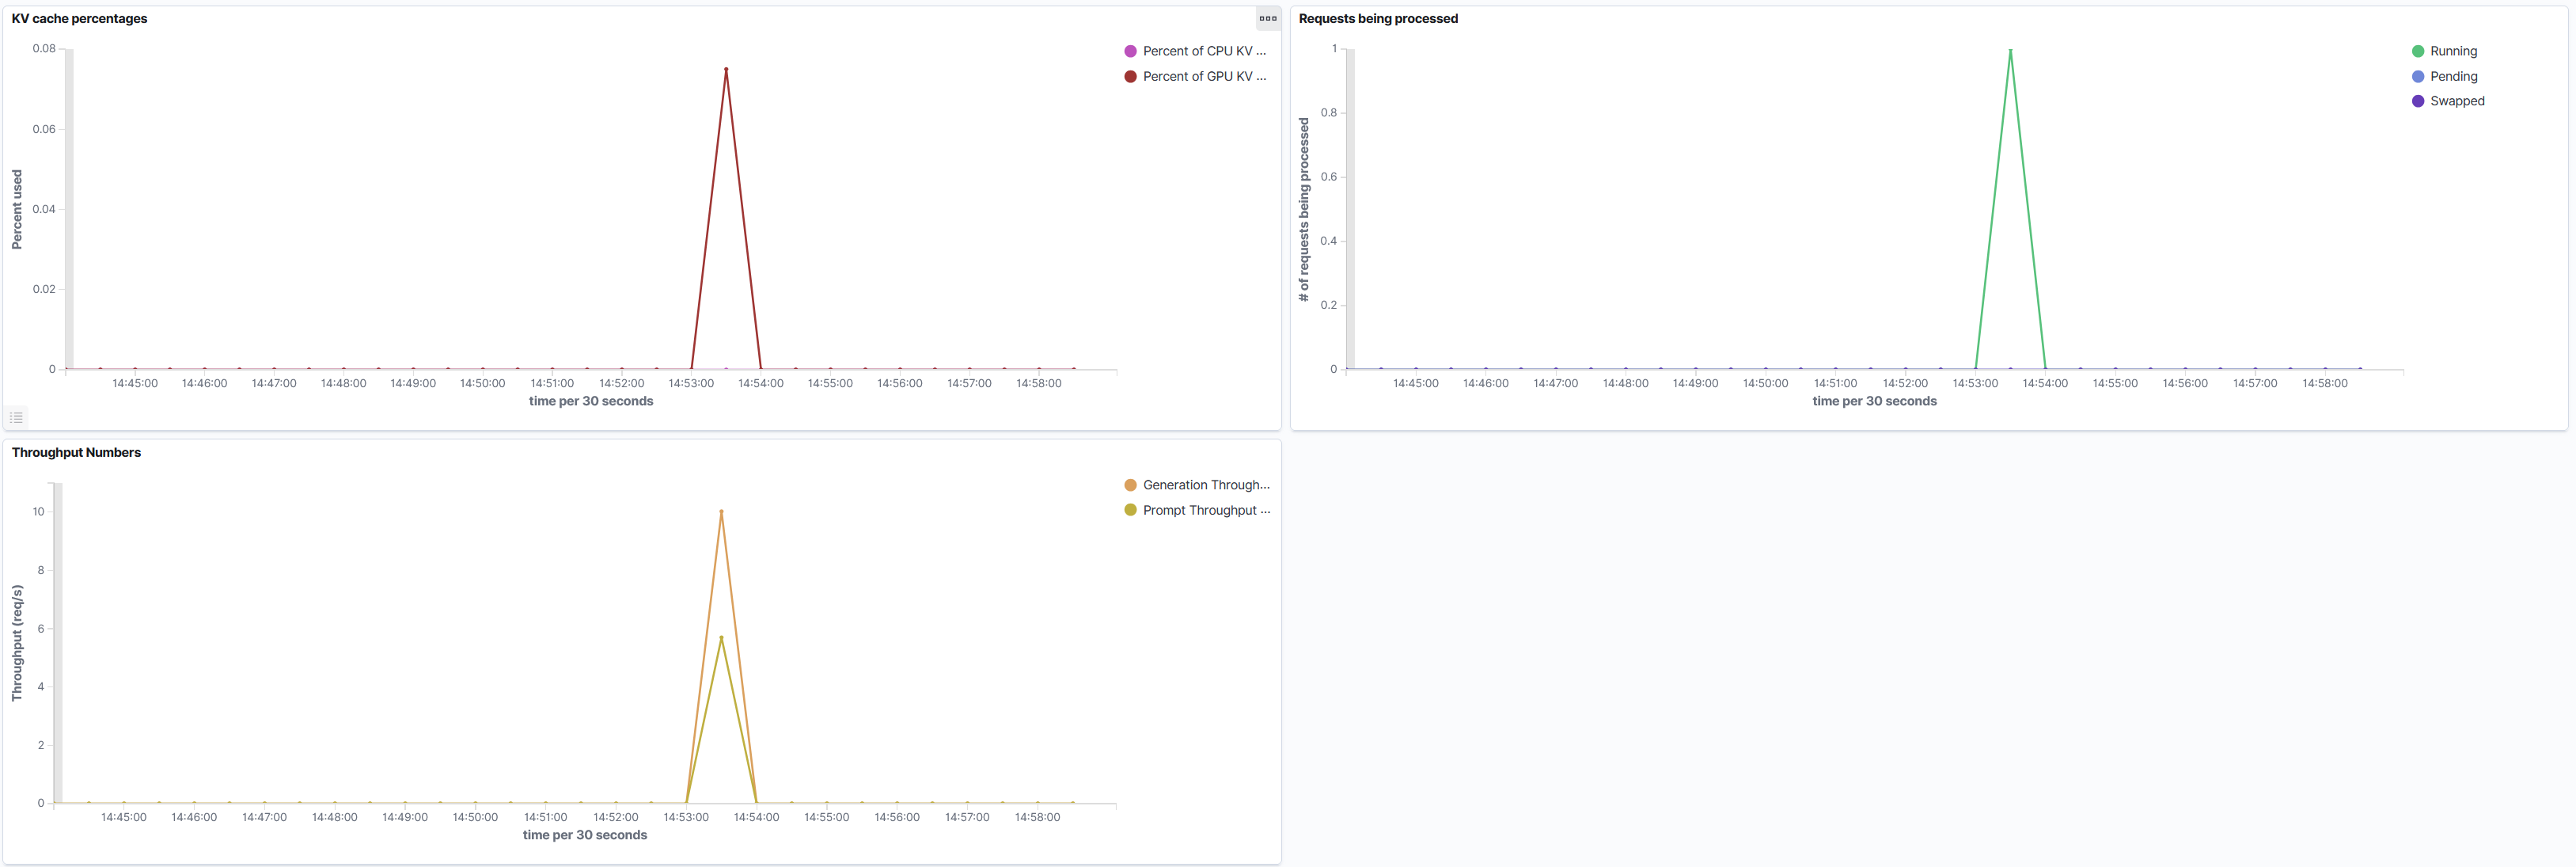
VLLM Metrics
KV Cache Percentage
The Key Value Cache hold previous tokens to retain context for the next tokens being generated. The percentage details how full the cache is. Larger cache usage will result in larger responses, which will effect the time it takes the model to output a response.
GPU Percentage
The cache will always reside on the GPU, you will see this percentage fluctuate as your prompts run. If this value is hitting 100% it's a sign their isn't enough VRAM to use for prompt generation.
CPU Percentage
This value should remain at zero percent since VLLM should not be swapping requests over from the GPU. However, if you see CPU percentage being used it's related to memory pressure on the GPU.
Requests Being Processed
These metrics show how active VLLM is during a point of time.
Running
Details the number of requests currently running at a point in time.
Pending
Details the number of requests currently pending at a point in time. This value being high denotes GPU pressure.
Swapped
Details the number of requests being swapped. This value being high denotes memory pressure.
Throughput Numbers
These metrics shows the requests per second going through the populate phase or inference phase at a point in time.
Prompt Throughput
Indicates the rate at which the model takes in the prompt tokens. The larger the prompt the more time it will take to parse the tokens.
Generation Throughput
Indicates the rate at which the model generates response tokens. This can be constrained by prompt engineering. The more info in the source data in addition to open ended prompting can result VLLM taking longer to generate response tokens per request.
Utilizing the MetricsIf prompt generation is slow, you will want to look at these metrics to determine what could be causing the issue.
There are two methods to approach the metrics in this documentation. It's best to look at the VLLM metrics first to get an idea if the hardware may be experiencing bottle necks or the amount of chunks returning from RAG needs to be adjusted. General prompt engineering may need to be looked at as well.
Utilizing the Generative API Endpoints Parameters will help with addressing slow prompt generation. You can use
num_hitsandchunk_sizeto increase Prompt and Generation Throughput. Furthermore, if you are usingrawTextit may be worth uploading the sources into Layar and utilizing RAG to limit the amount of tokens being given to the model.General prompt engineering will help with performance, using phrases like "Be succinct" or "Respond with 200 words or less" will increase Generation Throughput.
Please reach out to [email protected] if you have further questions.
Updated 6 months ago